Attention
Attention
netdata (http://my-netdata.io) is a "Simple. Effective. Awesome!" monitor which can monitor almost everyting on your Linux/FreeBSD system. You can visit its website to check online demo.
We will show you how to install and configure netdata on iRedMail server (Linux) to monitor mail service related software.
netdata requires some tools to get stastics data from other software, let's install it first.
yum install curl libmnl libuuid lm_sensors nc PyYAML zlib iproute MySQL-python python-psycopg2
apt-get install zlib1g libuuid1 libmnl0 curl lm-sensors iproute2 netcat python3-mysqldb python3-psycopg2
Download the latest netdata from its github project page, and upload to iRedMail server: https://github.com/netdata/netdata/releases
We use version 1.34.1 for example in this tutorial.
We assume you upload the package to /root/netdata-v1.34.1.gz.run.
Install netdata:
cd /root/
chmod +x netdata-v1.34.1.gz.run
./netdata-v1.34.1.gz.run --accept
netdata installs its files under /opt/netdata/ by default, let's create
symbol link of the configuration and log directories:
ln -s /opt/netdata/etc/netdata /etc/netdata
ln -s /opt/netdata/var/log/netdata /var/log/netdata
netdata will create required systemd script for service control, also logrotate config file, so there's not much we need to do after the package installation.
Main config file of netdata is /etc/netdata/netdata.conf, it contains many
parameters with detailed comments. Here's the
config file
used by iRedMail:
127.0.0.1 and port 19999 by default. Since it doesn't
have ACL control, we will run netdata behind Nginx to get ACL control done in
Nginx.[registry]
enabled = no
[global]
bind to = 127.0.0.1
run as user = netdata
default port = 19999
update every = 3
[plugin:proc]
# Disable IPVS check since iRedMail doesn't use ipvs by default
/proc/net/ip_vs/stats = no
# inbound packets dropped
/proc/net/dev = no
netdata ships a lot modular config files to gather information of software running on the server, they have very good default settings and most config files don't need your attention at all, including:
But some applications do require extra settings, we will cover them below.
OpenLDAP supports an optional monitoring interface you can use to obtain
information regarding the current state of your OpenLDAP server. For instance,
the interface allows you to determine how many clients are connected to the
server currently. The monitoring information is provided by a specialized
backend, the monitor backend. A manual page, slapd-monitor(5) is available.
netdata-1.11.1 (released on 23 Nov 2018) supports monitoring OpenLDAP through
its monitor backend.
To enable monitor backend in OpenLDAP, please append lines below in
slapd.conf:
/etc/openldap/slapd.conf/etc/ldap/slapd.confAttention
You must replace dc=example,dc=com by the real LDAP suffix that you use.
database monitor
access to dn="cn=monitor"
    by dn.exact="cn=Manager,dc=example,dc=com" read
    by dn.exact="cn=vmail,dc=example,dc=com" read
    by * none
It enables OpenLDAP backend monitor, also grant read access to dn
cn=Manager,dc=example,dc=com and cn=vmail,dc=example,dc=com. Again, you
must replace dc=example,dc=com by the real LDAP suffix that you use.
On Debian/Ubuntu, please also find lines in slapd.conf like below:
modulepath /usr/lib/ldap
moduleload back_mdb
Append a new moduleload directive right after moduleload back_mdb like
below:
moduleload back_monitor
Now restart OpenLDAP service.
Create file /opt/netdata/etc/netdata/python.d/openldap.conf with content below:
Attention
dc=example,dc=com by the real LDAP suffix that you use.<password-of-vmail> by the real password of
cn=vmail. You can find it in files under /etc/postfix/ldap/.update_every: 5
local:
username : "cn=vmail,dc=example,dc=com"
password : "<password-of-vmail>"
server : "localhost"
port : 389
timeout : 1
Now restart netdata service.
We need to enable stub_status in Nginx to get detailed server info, also
update php-fpm config file to enable similar feature.
/etc/nginx/templates/stub_status.tmpl with
content below:location = /stub_status {
stub_status on;
access_log off;
allow 127.0.0.1;
deny all;
}
location = /status {
include fastcgi_params;
fastcgi_pass php_workers;
fastcgi_param SCRIPT_FILENAME $fastcgi_script_name;
access_log off;
allow 127.0.0.1;
deny all;
}
/etc/nginx/sites-enabled/00-default.conf,
include new snippet config file stub_status.tmpl after the
redirect_to_https.tmpl line like below:server {
...
include /etc/nginx/templates/redirect_to_https.tmpl;
include /etc/nginx/templates/stub_status.tmpl; # <- add this line
...
}
www.conf, enable parameter pm.status_path
like below:/etc/php-fpm.d/www.conf/etc/php5/fpm/pool.d/www.conf/etc/php/7.0/fpm/pool.d/www.conf (note: php version number may be different on your server)pm.status_path = /status
Warning
Netdata supports monitoring Dovecot-2.2 or before, not 2.3.
We need to enable statistics module in Dovecot.
/etc/dovecot/dovecot.conf, append plugin
stats in global parameter mail_plugins, and imap_stats for imap protocol:mail_plugins = ... stats
protocol imap {
mail_plugins = ... imap_stats
...
}
plugin {
    # how often to session statistics (must be set)
    stats_refresh = 30 secs
    # track per-IMAP command statistics (optional)
    stats_track_cmds = yes
}

service stats {
    fifo_listener stats-mail {
        user = vmail
        mode = 0644
    }

    inet_listener {
        address = 127.0.0.1
        port = 24242
    }
}
netdata requires a SQL user (we use netdata here) with privilege USAGE to
gather MySQL server information.
<password> in
command below by the real (and strong) password).# mysql -u root
sql> GRANT USAGE ON *.* TO netdata@localhost IDENTIFIED BY '<password>';
sql> FLUSH PRIVILEGES;
Create file /etc/netdata/python.d/mysql.conf with content below.
Attention
<password> below by the real password.tcp:
name: 'local'
host: '127.0.0.1'
port: '3306'
user: 'netdata'
pass: '<password>'
netdata requires a SQL user (we use netdata here) to gather PostgreSQL server
information.
<password> in
command below by the real (and strong) password).# su - postgres
$ psql
sql> CREATE USER netdata WITH ENCRYPTED PASSWORD '<password>' NOSUPERUSER NOCREATEDB NOCREATEROLE;
Create file /etc/netdata/python.d/postgres.conf with content below.
Attention
<password> below by the real password.socket:
name : 'local'
user : 'netdata'
password : '<password>'
database : 'postgres'
To get better performance, netdata requires few sysctl settings. Please add
lines below in /etc/sysctl.conf:
vm.dirty_expire_centisecs=60000
vm.dirty_background_ratio=80
vm.dirty_ratio=90
Also increase max open files limit.
mkdir -p /etc/systemd/system/netdata.service.d
Create file /etc/systemd/system/netdata.service.d/limits.conf:
[Service]
LimitNOFILE=30000
Reload systemd daemon:
systemctl daemon-reload
/etc/nginx/templates/netdata.tmpl with
content below:# Running netdata as a subfolder to an existing virtual host
# FYI: https://github.com/firehol/netdata/wiki/Running-behind-nginx
location = /netdata {
return 301 /netdata/;
}
location ~ /netdata/(?<ndpath>.*) {
proxy_redirect off;
proxy_set_header Host $host;
proxy_set_header X-Forwarded-Host $host;
proxy_set_header X-Forwarded-Server $host;
proxy_set_header X-Forwarded-For $proxy_add_x_forwarded_for;
proxy_http_version 1.1;
proxy_pass_request_headers on;
proxy_set_header Connection "keep-alive";
proxy_store off;
proxy_pass http://127.0.0.1:19999/$ndpath$is_args$args;
gzip on;
gzip_proxied any;
gzip_types *;
auth_basic "Authentication Required";
auth_basic_user_file /etc/nginx/netdata.users;
}
/etc/nginx/sites-enabled/00-default-ssl.conf,
include new snippet config file netdata.tmpl before the
misc.tmpl line like below:server {
...
include /etc/nginx/templates/netdata.tmpl; # <- add this line
include /etc/nginx/templates/misc.tmpl;
...
}
/etc/nginx/netdata.users used for basic http auth:touch /etc/nginx/netdata.users
<password> below by a real, strong password.doveadm pw -s SSHA -p '<password>'
The password looks like this {SSHA}Tama1midwSV6XWTlonR6n6sNM8yuEPvv.
/etc/nginx/netdata.users with your faviourite text
editor, add a line like below to create an account used to access netdata.
The format is <username>:<password>.postmaster@domain.com:{SSHA}Tama1midwSV6XWTlonR6n6sNM8yuEPvv
Now open a web browser and access url https://your-server/netdata/ (please
replace your-server by the real domain name), it will ask you to input
username and password for authentication, please use the account we just added
in file /etc/nginx/netdata.users to login.
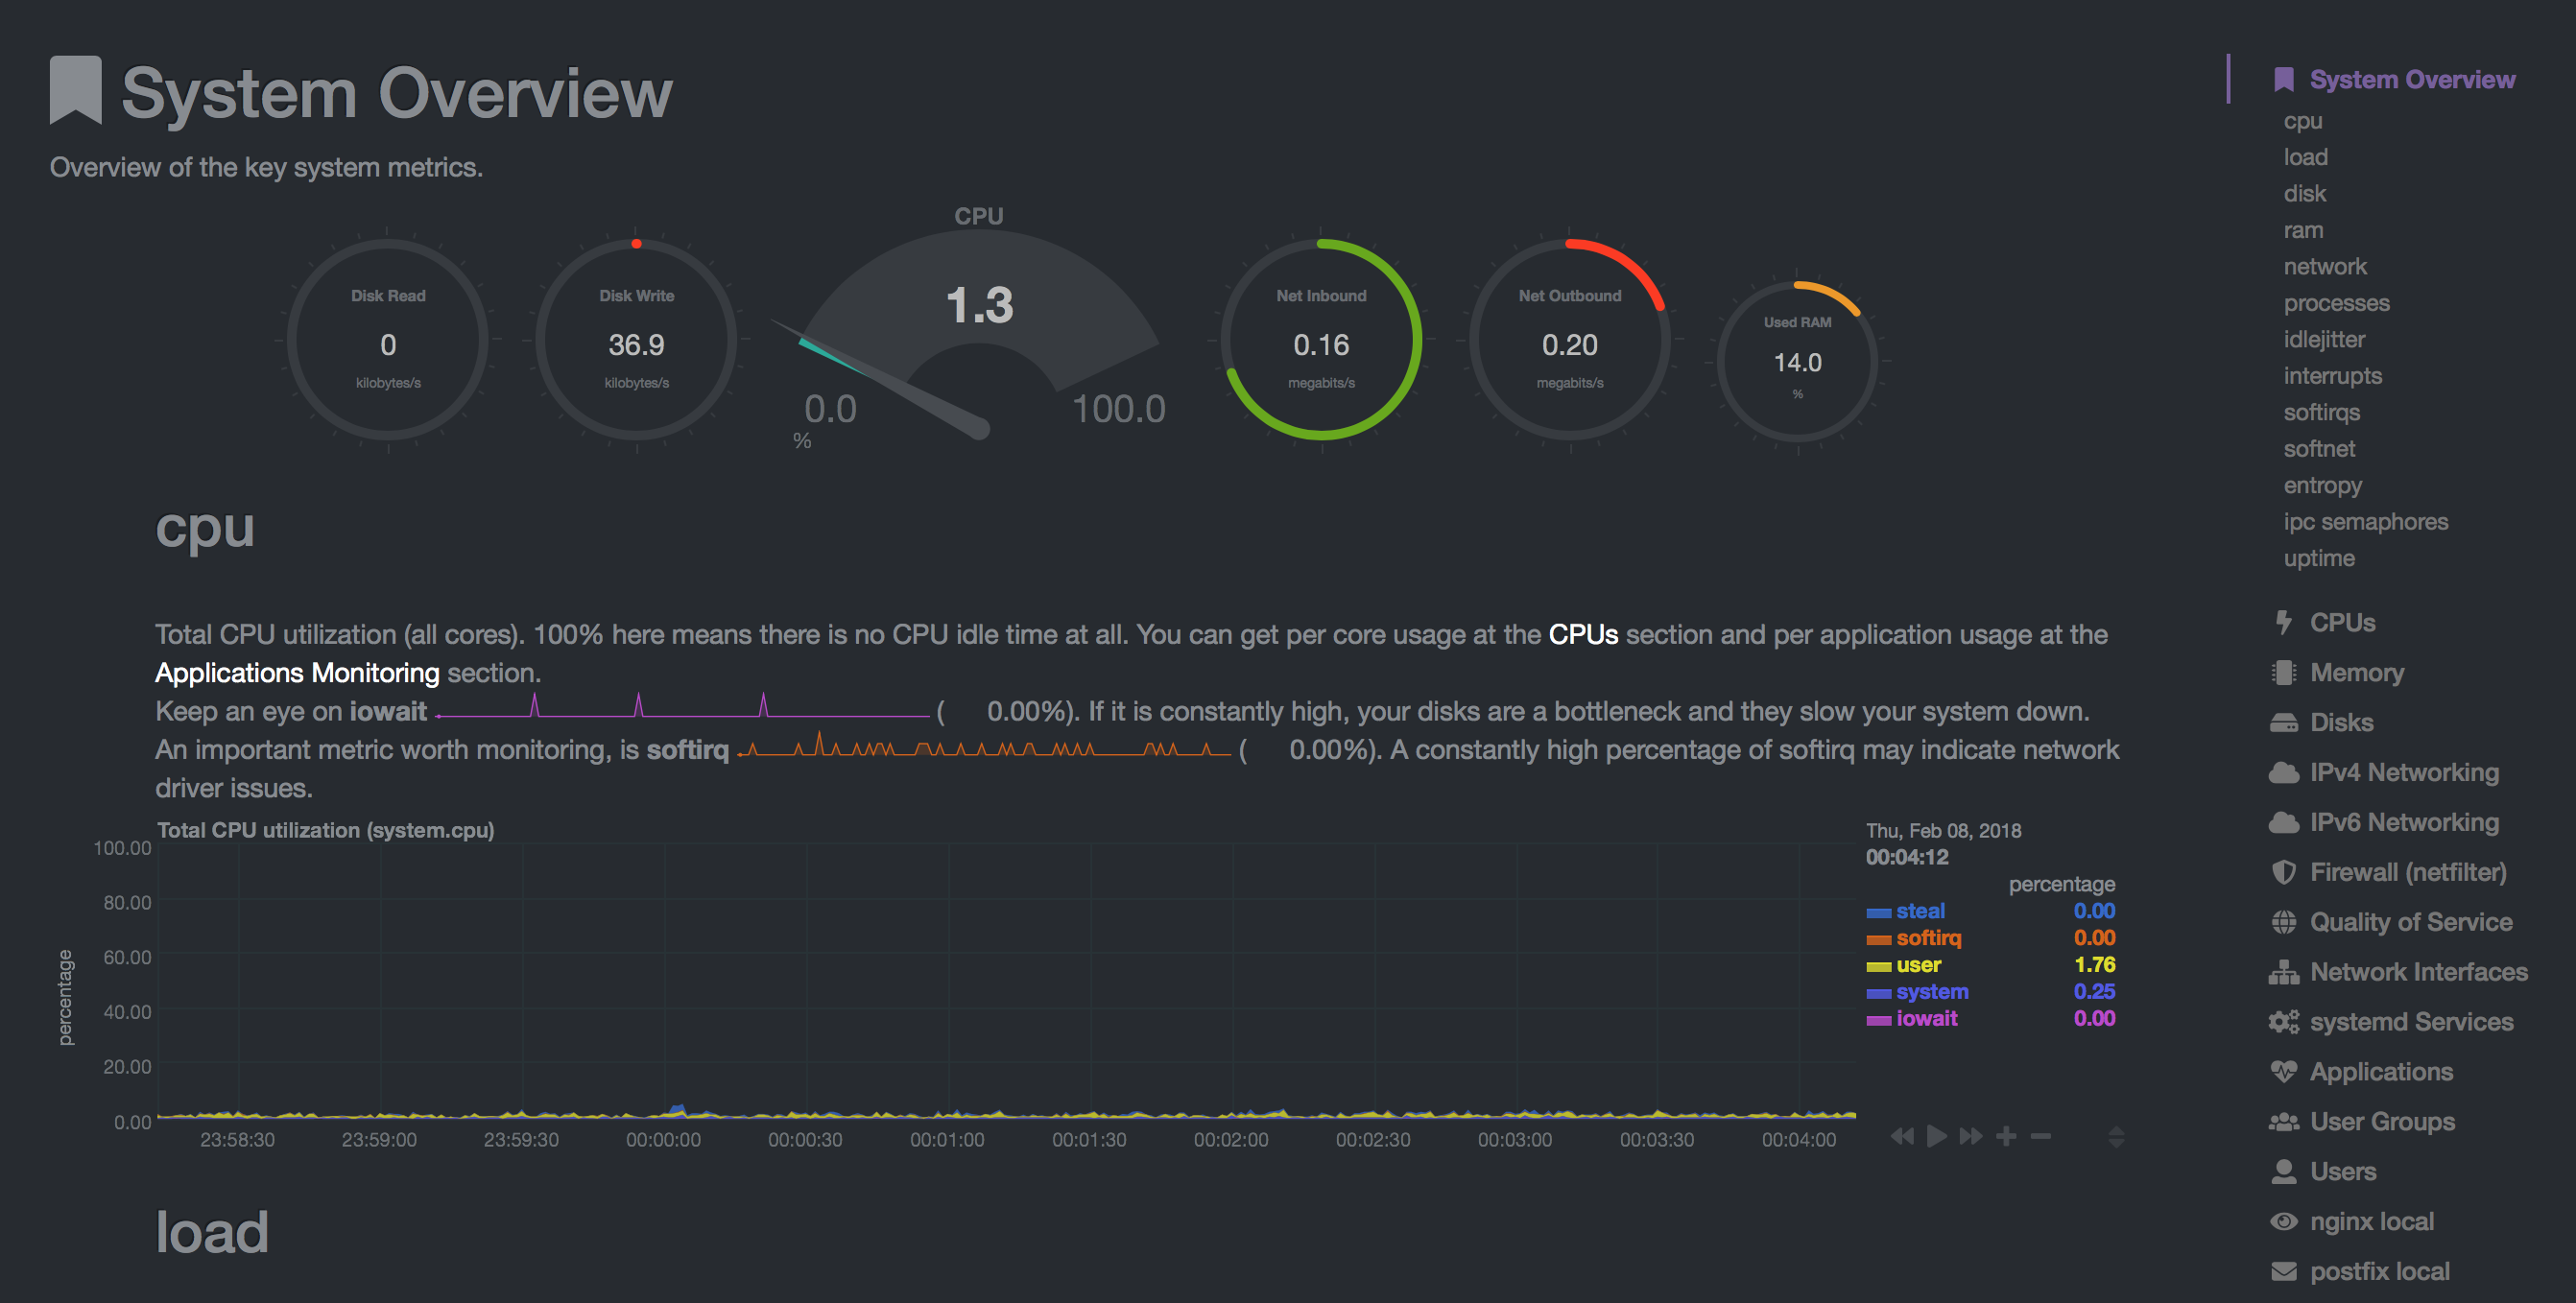
This is what you see after successfully logged in:
To update netdata, just download new version of the prebuilt package from its github page, then run it:
chmod +x netdata-latest.gz.run
./netdata-latest.gz.run --accept
That's it.